
Investing in the stock market can be a great way to grow your wealth over time, but it requires careful stock analysis and research to make informed decisions. There are several methods for analyzing a stock’s potential for investment, each with its own advantages and limitations. By combining different methods and taking a comprehensive approach, investors can gain a clearer understanding of the stock’s financial strength, growth potential, and valuation. In this article, we will discuss the top methods for analyzing a stock for investment purposes.
Contents
Stock analysis(Method 1): Fundamental Analysis
:max_bytes(150000):strip_icc()/FundamentalAnalysis_Final_4195918-eea2436ba2374e23930b0a482adbea2f.jpg)
Fundamental analysis is a widely used method of evaluating a company’s financial health and performance. This method involves examining a company’s financial statements, including its income statement, balance sheet, and cash flow statement, to understand its financial strength. Additionally, it evaluates the management team, competitive position, and growth prospects of the company.
To perform fundamental analysis, investors typically look at several financial metrics, including revenue, earnings per share (EPS), price-to-earnings (P/E) ratio, price-to-book (P/B) ratio, return on equity (ROE), and debt-to-equity (D/E) ratio.
Revenue is an important metric for evaluating a company’s growth potential, and it’s essential to look at revenue growth trends over time to determine whether the company is growing or stagnating. EPS is a measure of a company’s profitability and represents the company’s earnings divided by its outstanding shares. A higher EPS indicates that the company is more profitable, and its stock price may be more likely to increase. P/E ratio is a measure of how much investors are willing to pay for each dollar of earnings a company generates.
A higher P/E ratio may indicate that investors expect the company’s earnings to grow in the future. P/B ratio compares a company’s stock price to its book value, which is the value of its assets minus liabilities. A lower P/B ratio may indicate that the company’s stock is undervalued. ROE is a measure of how effectively a company is using its equity to generate profits, and a higher ROE indicates that the company is more efficient in generating profits. D/E ratio compares a company’s debt to its equity and is an important metric for evaluating a company’s financial health. A high D/E ratio could indicate that the company has taken on too much debt and may be at risk of defaulting on its loans.
In addition to financial metrics, fundamental analysis also evaluates the quality of a company’s management team and its competitive position. Investors should look at the company’s management team’s experience, track record, and vision for the company. Additionally, investors should evaluate the company’s competitive position by looking at its market share, customer base, and product or service offerings.
Stock analysis(Method 2): Technical Analysis
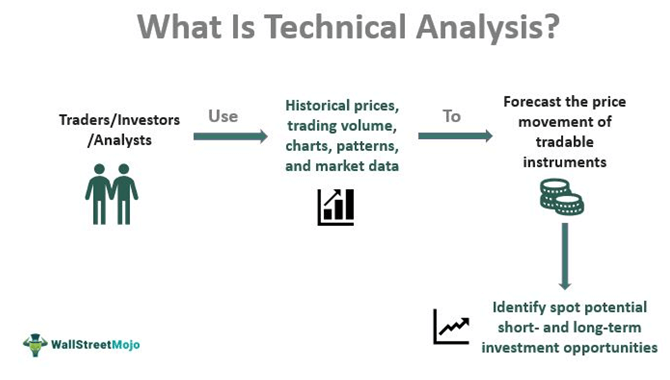
Technical analysis is a method of analyzing stocks that evaluates the stock’s price and volume data to identify patterns, trends, and other indicators that can help predict future price movements. This approach assumes that historical price and volume data can predict future price movements.
To perform technical analysis, investors typically use charts and other tools to identify trends and patterns in a stock’s price and volume data. Common technical indicators include moving averages, relative strength index (RSI), and Bollinger Bands.
Moving averages are used to identify the trend of a stock’s price movement. A simple moving average (SMA) is calculated by averaging a stock’s closing prices over a set period, such as 20 days. An exponential moving average (EMA) gives more weight to recent price data. RSI measures the momentum of a stock’s price movement and can be used to determine whether a stock is overbought or oversold.